
So we got wind of a brand new app on the block, one that may well replace our favorite dual-core benchmarking application Smartbench 2011 in a heartbeat. Of course, we’d never wish such a thing to happen, and given that we’ve recently had such awesome fun with that benchmarking system, we wish them only the best, but let’s have a look at another option here. This is CF-Bench, a benchmarking tool that’s got support for testing multiple cores on your Android device, allowing you to test both native and managed code – joyous day, let’s see who gets the best!
Thus far we’ve tested a pocketful of dual-core devices on LG, HTC, Samsung, and Acer, but we’re going to rely on YOU to grab the rest. Not only does this benchmarking system compare your scores in the following ways: Native, Java, and Overall, it give you quantifiable scores on more internal factors than any benchmarking system we’ve ever seen in the past. This application not only benchmarks your entire system in a matter of around 3-5 minutes, it does so for free. You’ll notice the ad right after the title of the app when you open it.
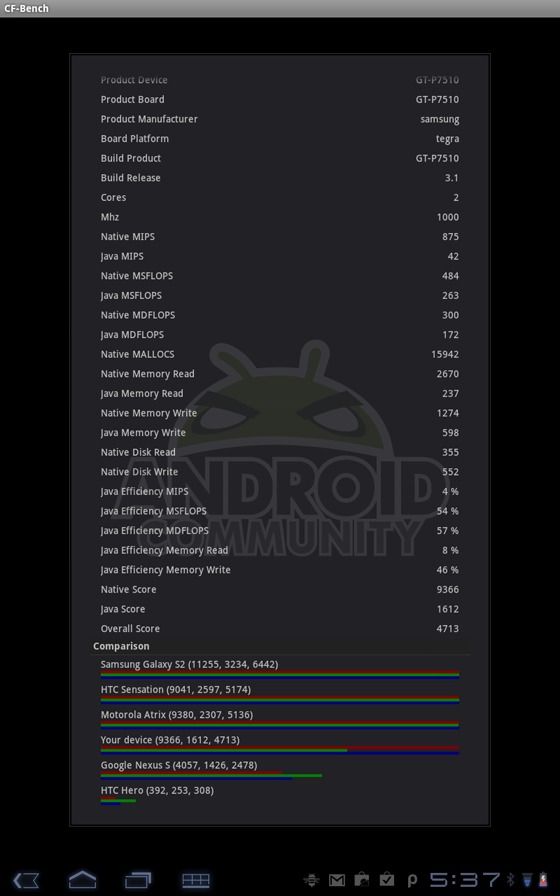
And open it you shall! This application is free on the Android Market and, if you’ll take a look at the developers collection of apps, sits right next to some excellent other apps you may have heard of in the past such as Chainfire3d. Below you’ll see several devices that we’ve tested so far, each of them a dual-core device several of them using an NVIDIA Tegra 2 dual-core 1GHz processor, and we need your help to complete the circle! You know what that means – testing time!
This app has been tested behind the scenes by the developer but is BRAND NEW on the market when this post is posted – less than 100 downloads! Grab the app from the market for free now and get to testing!
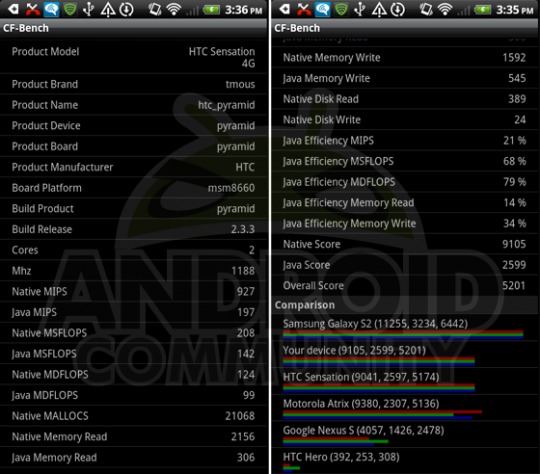
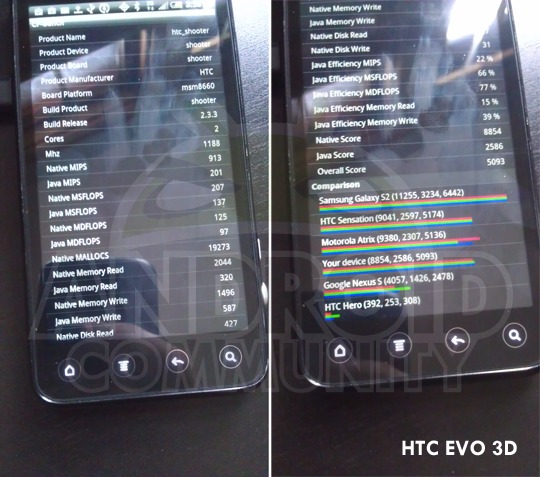
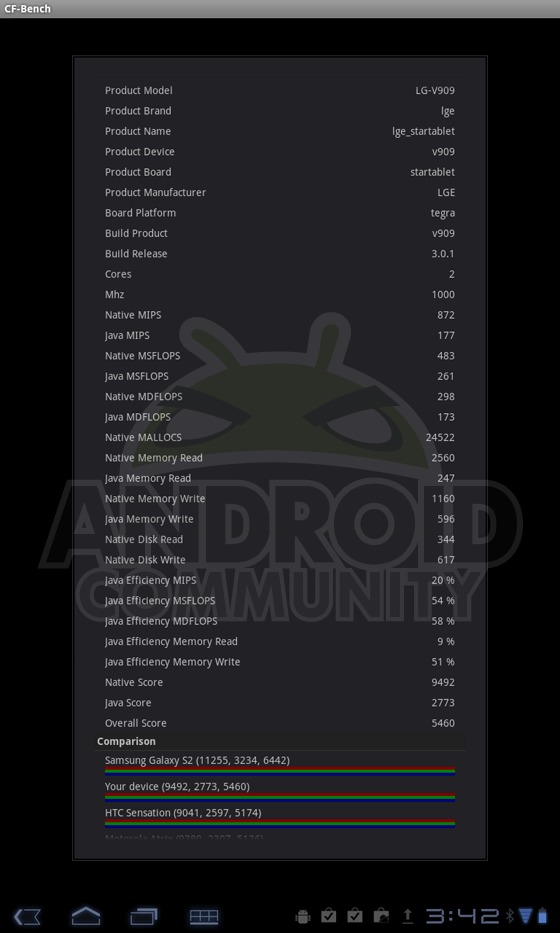
![]()
Then here’s a temporary graph until we get the much more awesome method of showing you these scores up and running. Does the winner surprise you? Each device is listed in order of total overall score.
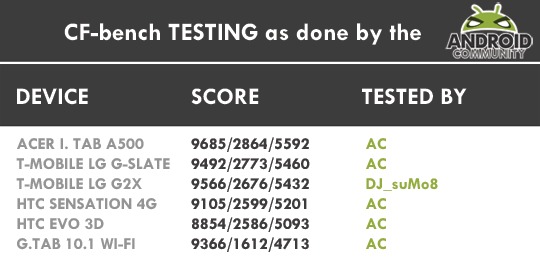


G2x on the second run scored: 9566, 2676, 5432. Can’t wait to see if there’s a difference with benchmarks with the Gingerbread update.
Can we please have a proper graph created? not just copy and paste pictures. subpar
yes sir, coming up right away sir
sweet. can’t wait to download and start testing
im testing my nexus s at 1.544ghz right now. its doing pretty well for a single core.. 6369, 2313, 3935 so far.
That’s sick for a single core… its beating out the stock scores for sure.
Is “Native Disk Write” testing the write speed of the internal or external SD? I scored a 12 on that test with my G2x.
Xoom, stock kernel 3.1 : 9701,2418,5331
Samsung Galaxy S2 1.2GHz, Stock Kernel, Gingerbread 2.3.3 :11378, 3249, 6500
Samsung Galaxy S2 1.2GHz, Stock Kernel, Gingerbread 2.3.3 :11378, 3249, 6500
Moto Xoom 1.6GHz on 3.1 w/ Launchpad Kernel v. 1.1.0
Scores: 15307, 4265, 8681
is that the tegra SoC??