If you were to run Speedtest on your mobile device, you’d likely find that your WiFi connection isn’t quite what you pay for. A new study by Ookla, the team behind Speedtest, note who the biggest offenders are, as well as which providers may be giving you more bang for your buck. We also find information on where not to live if you enjoy great Internet connectivity.
Basing their findings on percentage of what was promised versus overall download data metrics, Ookla has compiled a list of domestic Internet providers. Smaller players like Midcontinental Communications and Earthlink were found to provide quite a bit more than promised, with Midcontinental offering an 8% boost. Larger players like Verizon FIOS, Time Warner, and Comcast were found to offer roughly what they promised to.
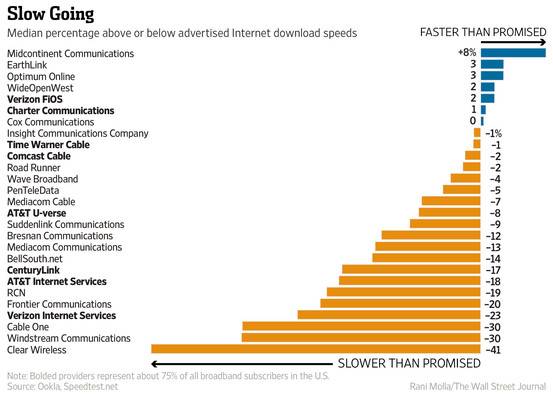
As you slip down the scale, you ay notice your provider popping up, suggesting your problems with Internet speeds aren’t unique. AT&T U-Verse offers roughly 10% less than they sell you, while the AT&T Internet Service — a legacy offering — is twice as worse at 19%. Verizon’s legacy Internet is equally terrible, delivering about 23% less than what customers are paying for. The worst? Clear Wireless, which gives you a staggering 41% dip in performance versus what they sell you on.
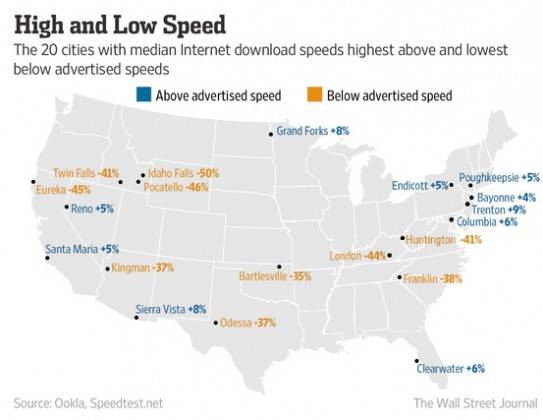
Similarly, we find the study highlighting which cities see the biggest swings. If you live in Trenton, New Jersey — you’re in luck. Citizens there get about 9% more than they pay for, while Poughkepsie, New York sees a 5% uptick. Sierra Vista, Arizona has an 8% overage for data speed transfers, while Grand Forks, Minnesota matches them. If you rely on Internet, stay out of Idaho — Twin Falls, Pocatello, and Idaho Falls all see 40%-plus speed drops, with Idaho Falls being the worst at a 50% slide.
The data was cobbled together from “tens of millions” of speed tests run via the Internet or apps, as well as survey of 646,404 users. The data was compiled over the past 12 months, giving a vast sampling to appreciate here. If you’re experiencing a diminished service from your Internet provider, it might be time to shop around.
Source: Ookla







I have CenturyLink and pay for 40Mbps, they send me 45Mbps and sometimes even 50Mbps.
I think plus or minus 10% is fine. The real world is a difficult place. the players on the bottom of that scale should really up their game or change their marketing.
I guess charter is stepping up their game positive 2
The server you pick matters my closest is also my slowest.
Am I missing something here? Is this article based on wired consumer broadband connection speeds as measured through a smartphone via a Wi-Fi certified wireless network?
Won’t WiFi generally slow down internet speeds compared to ‘socket speed’? I’m paying for 50/10mbit, and my main computer with a wired connection to a gigabit LAN gets 50/10 just fine. My phone, connecting through an older 801.11n wireless connection, only recieves around 30/9.
Does the dataset used in this article only cover Android-based hardware (linked), or also iOS systems? As it seems to only focus on wireless connectivity speeds, I would also really like to see the numbers for the much more general service provided directly by their website http://www.speedtest.net, to see if there was a difference between wireless-only speeds and mixed connectivity speeds.
I’m going to call bull on this. my dsl is only -5% but i pay but charter is minus almost 60% here
Company A sells you 100meg for $40 but only gives you 75meg. Company B sells you 20meg for $40 but gives you 25meg. What would you choose? This doesn’t show speeds vs cost. I’ll still take company A and only receive 75% of the advertised speed.
I have 100mb and during peak traffic it dips to around 70-80. Off times I get 104. I have no problem with this.
How about company c that sells you 30 megs and gives you 60.
Fyi it is Midcontinent communications NOT MIDCONTINENTAL.
don’t see any WA data? we don’t seem to have the problem because we don’t want to rip customers off or pay bribes to companies to have faster speeds…