


Every first week of each month, Google diligently announces the latest statistics on Android versions. Information are gathered by looking at the Google Play Developer Console that details statistics about the active Android devices all over the world. We usually look at the number of units running each Android version, sharing the same sizes and densities, as well as, OpenGL version.
These Android distribution data is important because it allows developers and consumers to know which Android versions or mobile devices to prioritize. The numbers tell us how many people are active within the Android community and the Google Play ecosystem.
Google particularly looks at devices that have the latest version of the Google Play Store app. The numbers below only represent those that have accessed the Play Store in the past week.
Most Android phones, about 33.2%, still run Android Lollipop. Two versions of the Lollipop captured the market followed by Marshmallow with 26.3% and KitKat with 24%. The newest Android 7.0 Nougat is only on 0.4% of the sample. Jellybean only has 12.8% of the market while the earlier Android versions–Ice Cream Sandwich, Gingerbread, and Froyo–only now capture less than five percent combined.
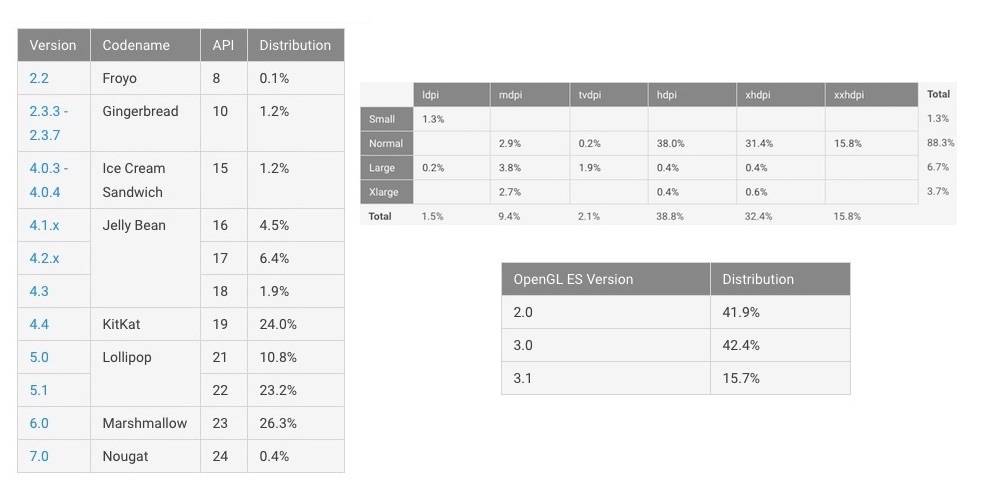
When it comes to screen sizes, about 38.8% of mobile screens have hdpi, followed by xhdpi (32.4%) and xxhdpi (15.8%). Looking at the OpenGL ES Version, 42.4% are on version 3.0. It’s close to the 2.0 with 41.9% while 3.1 are on 15.7% of the devices.
SOURCE: Android Developers


