The fine folks at Nielsen over at Nielsen Wire have done some calculating and have found a couple of interesting statistics. First, and perhaps most obviously, from what Nielsen Smartphone Analytics have come up with after metering thousands of Android smartphones, the average Android smartphone user spends 67% of their on-device time, or 56 minutes per day, on apps, while 33% of their smartphone time is spent on the mobile web. This is of course an average person who only spends about an hour and a half on their device a day, a figure I’m sure all of you trump before breakfast is over.
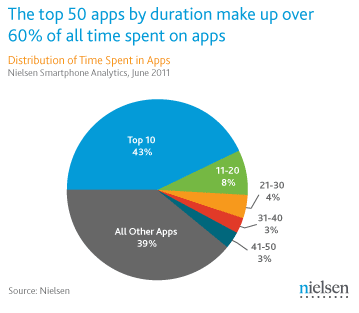
Then comes the information on the apps. What’s interesting here is that the top 10 apps in the Android Market do really appear to hold sway over the device market with a steel grip. While there are thousands of apps on the market (hundreds and hundreds of which are duds, of course, but regardless,) the top TEN apps take up 43% of all the time spent by Android consumers on mobile apps. The top 50 apps then account for 61% of all time spent.

At this moment there are 250,000+ apps on the Android Market – the major bulk of these must compete for 39% of the tasty, tasty pie. And what are these top ten apps, you may be asking yourself? Certainly you’ve already got them all on your device this very moment:
Google Maps
YouTube
Facebook for Android
Pandora
Music Download
Kindle
Advanced Task Killer
Skype
Barcode Scanner
Zedge Ringtons & Wallpapers
Notable mentions:
Tiny Flashlight
Facebook Messenger
Sound reasonable to you?
[via Nielsen]


Advanced Task Killer… Really? :S
yeah, that’s an odd one on the list…
yeah, that’s an odd one on the list…
Due to the qwerky way Android handled system processes, I can see much
of this data being wrong. Inflating numbers for background services
such as “Advanced Task Killer”, and ignoring Widgets completely.