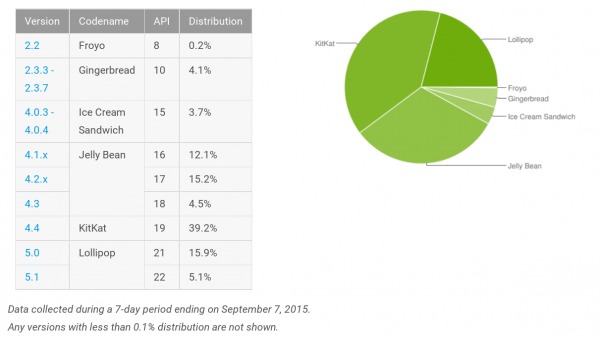
It’s time to take another look at how the half dozen versions of Android floating around the market. As essential as this information is to developers, it is also interesting to observe from a market analysis perspective. This month’s chart paints a positive picture, with a bit of foreboding in the air. All versions of Android have seen notable drops in numbers. That is, all except Android Lollipop, 5.0 and 5.1, which are now installed on as much as 21 percent of Android devices in the market.
Relatively speaking, it is Android 5.1 that actually saw the most significant increase, now at 5.1 percent, a 2.5 jump from last month’s 2.6 percent. Android 5.0 did rise but sadly only minimally, from 15.5 percent in August to 15.9 percent as of September 7. Still, it shows a very health adoption rate for the so far latest Android version, which has taken a fifth of the market in 6 months’ time.
As for the rest of the crew, everyone went down, even Android 4.4 KitKat, surprisingly. Android 2.2 Froyo is probably finally ready to throw in the towel at 0.2 percent, quite close to the 0.1 criteria that Google has for including Android versions in the list. Even the combined might of the Jelly Bean brothers wasn’t enough this time, now occupying 31.6 percent of the pie in total. And KitKat was nudged down just a wee bit from 39.3 to 39.2 percent.

As encouraging as these numbers might look, there is one caveat to this never ending defragmentation quest. Android 6.0 Marshmallow is just around the corner, which will add yet another major milestone to Android, but also another stumbling block to unifying Android devices and versions to make things easier for developers and eventually for users as well.
SOURCE: Google


My question is: What is froyo, gingerbread and ice cream sandwich still doing there? Those should already be non existent.