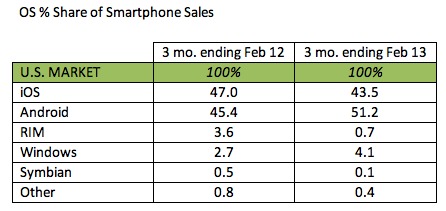
The latest market share numbers are in from Kantar and they are mostly what you would expect to hear. Android continues its steady growth, even if the growth rate for Android isn’t exactly spectacular. The numbers also show that iOS has continued its steady decline.
The most impressive number from Kantar for last quarter comes in rather surprising growth for Windows Phone and a blistering loss for BlackBerry. Compared to the same quarter a year ago, Windows Phone has grown 52% this year. Granted, Windows Phone is still very far behind Android and iOS on the smartphone market.
BlackBerry absolutely plummeted in the latest metrics posting an 81% decline in sales for the quarter. The numbers for Q1 of 2013 show that Android has 51.2% of the smartphone market overall. iOS on the other hand holds 43.5% of the smartphone market in the United States.
BlackBerry now has a scant 0.7% of the smartphone market. Windows Phone has 4.1% of the market leaving Symbian with only 0.1% of the market and other smartphone operating systems taking 0.4% of the market. Looking specifically at Android device manufacturers, Samsung continues to expand its lead over LG and HTC according to Kantar.
[via VentureBeat]


This was before blackberry released their new blackberry 10 OS phones. The real test will be in 10 months when we see if BlackBerry starts to regain market share with its new line of smart phones.
Wouldn’t it be great if we could actually get real numbers instead of these third party educated guesses?
It seems like every month or two we get a barrage of different and sometimes opposite reports of this type.
As a shareholder of both GOOG and AAPL (and even a little RIMM and MSFT), I’d really like to know the ACTUAL numbers.
Agreed! Why only Apple will release actual SALES numbers I have never understood! Even Samsung recently invented a new term “Channel Sales” aka “shipments”, aka “stuffing the channel”. Why do usage statistics not match this trend? Why does Comscore say Android declined last month and iOS went up? Confusing.