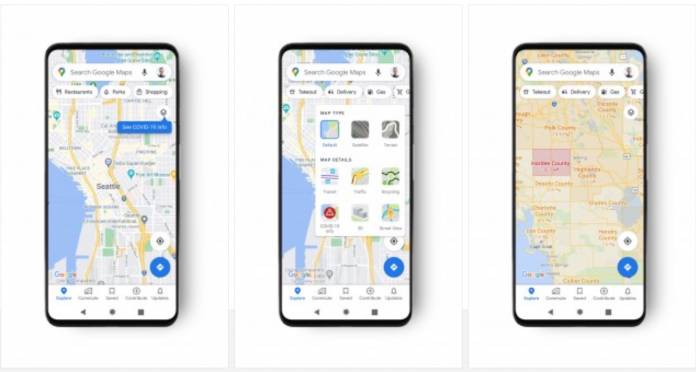
If you’re keeping up with all the latest COVID-19 news, then you probably are aware of the numbers both International and national. But for those who are more visual, they can understand those statistics better if presented in a visual chart or table, or hey, even a map. Google Maps is now rolling out a feature that would add a layer to the map you’re viewing where you can see the “critical information” about COVID-19 in your area or the place that you’re looking at.
How it works is pretty simple on Google Maps. At the top right-hand corner of your screen, you’ll see the layers button. Previously that’s where you went to change the Map Type (default, satellite, or terrain) and the Map Details filter for things like Transport, Traffic, Cycling, 3D, and Street View. But now you’ll get another layer for COVID-19 information. When you tap the filter, you’ll see the seven-day average of the new cases per 100,000 people in that area you’re looking at.
You’ll also see a Lebel that should tell you whether the cases are already trending downwards or if they are increasing. The label will be indicated by an arrow which will hopefully be pretty self-explanatory. They have also color-coded the maps to distinguish the density of the new cases in the area you’re looking at. This way, you sort of get a bigger or clearer picture on how th pandemic is affecting that area.
The data that they are using for this feature are from “multiple authoritative sources” like John Hopkins, the New York Times, and yes, Wikipedia. In turn these organizations get their information from the World Health Organization, government healthy ministries, and state and local heath agencies and hospitals. Google Search has also been using this information on their platform and so this is now being added to Maps.
The trending case data is now available at all the 220 countries and territories where Google Maps is available. There are also some states or provinces, counties, and cities where the data is available.


