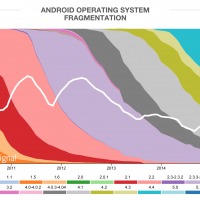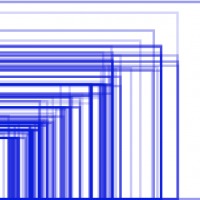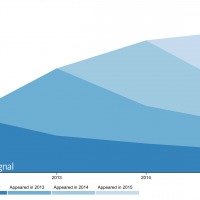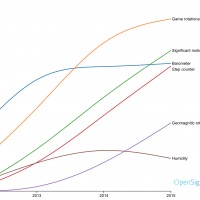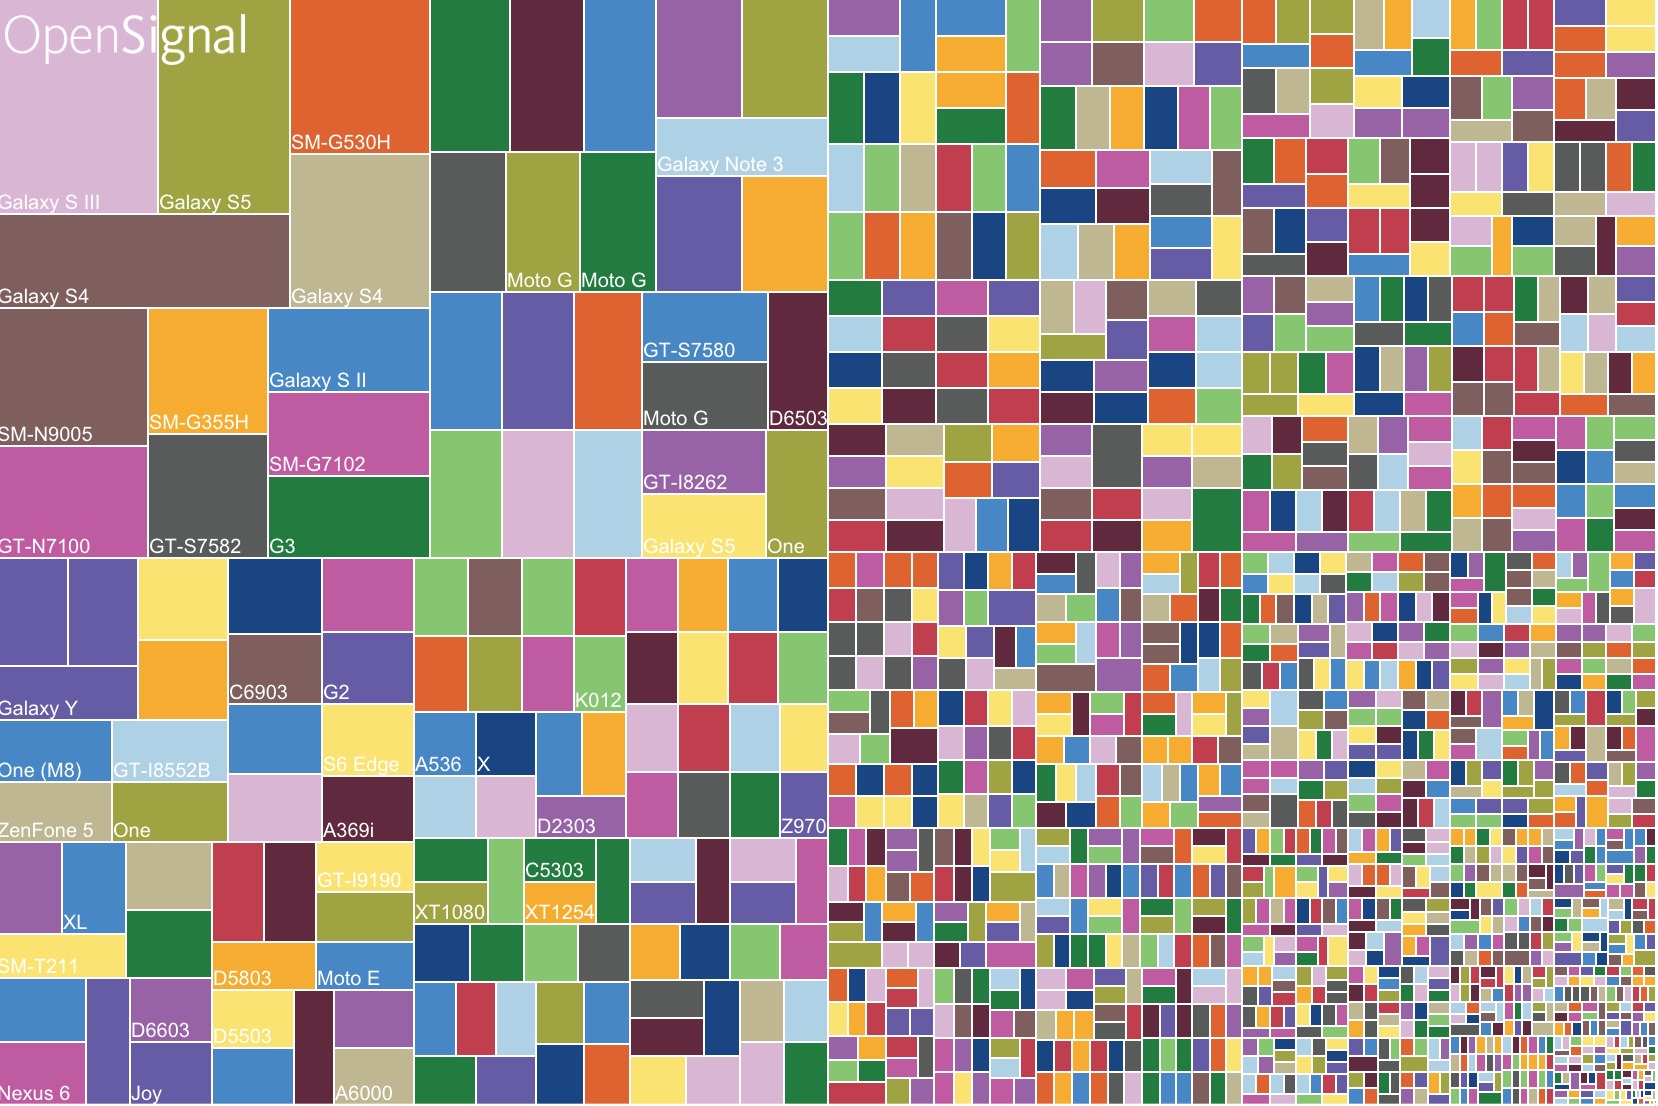
Unlike other digital ecosystems that have more solid figures when it comes to devices, OS, screen sizes, etc, the whole Android world is a bit fragmented. That is especially true over the past year as more and more brands are getting into the game and app developers are being challenged to come up with programs that will work well across all devices and operating systems. OpenSignal has released some cool visualizations of what this looks like so that developers can be guided accordingly.
In terms of device fragmentation, in just the past 24 months, there are now over 24,000 distinct devices that are in the market, which is more than double of the 11,868 which was back in 2013. The figures are from the 682,000 unique devices that have downloaded the OpenSignal app. When it comes to brand fragmentation, Samsung is still the clear market leader, with 37.8% share of the Android market, which is down from 2012 when they were at 47.5%. But this is due to the rise of other OEMs that have entered the market since then.
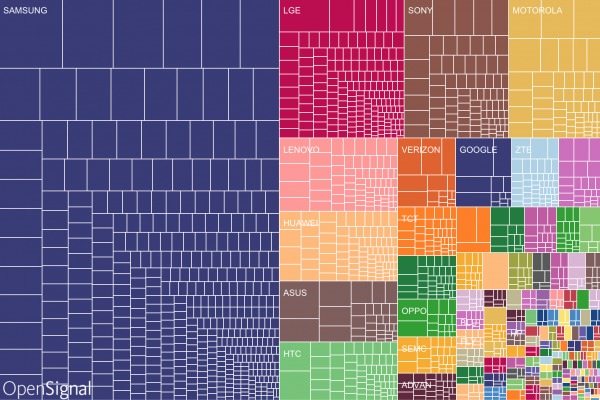
Even the versions of Android that users use is very much fragmented, although there has been a very slight reduction already over the past year, as the dominant API, which is currently KitKat, has seen a steady increase this year. The current API, Android 5.1 Lollipop, is still pretty low as some OEMs have not yet released the update and are still at Android 5.0, which is also still pretty low at 15.5%.
OpenSignal also shows other graphs in terms of screen size, brand proliferation, and even sensor prevalence. But one other illustration worth noting is the Android brand leaders for every country. Samsung still dominates most countries that have an Android presence, except for a few exceptions like China (Xiaomi), India (Sony), Argentina (LGE), among others.
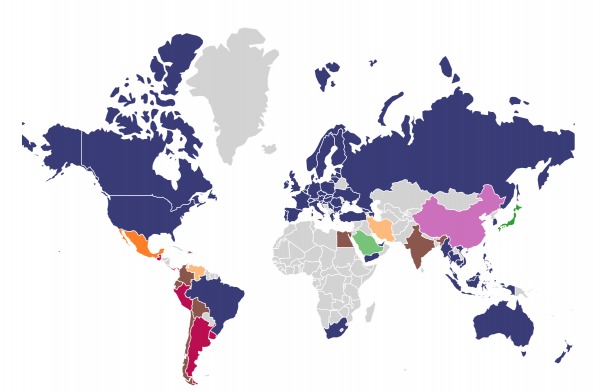
SOURCE: OpenSignal


