With little room for argument, Samsung has a rather large percentage of the Android market share in North America. This includes both smartphones and tablets. Despite the fact that Samsung releases numerous models in both spaces, there are only a few devices responsible for majority of the usage. Or more specifically, a few models in the smartphone space and a few screen sizes in the tablet space.
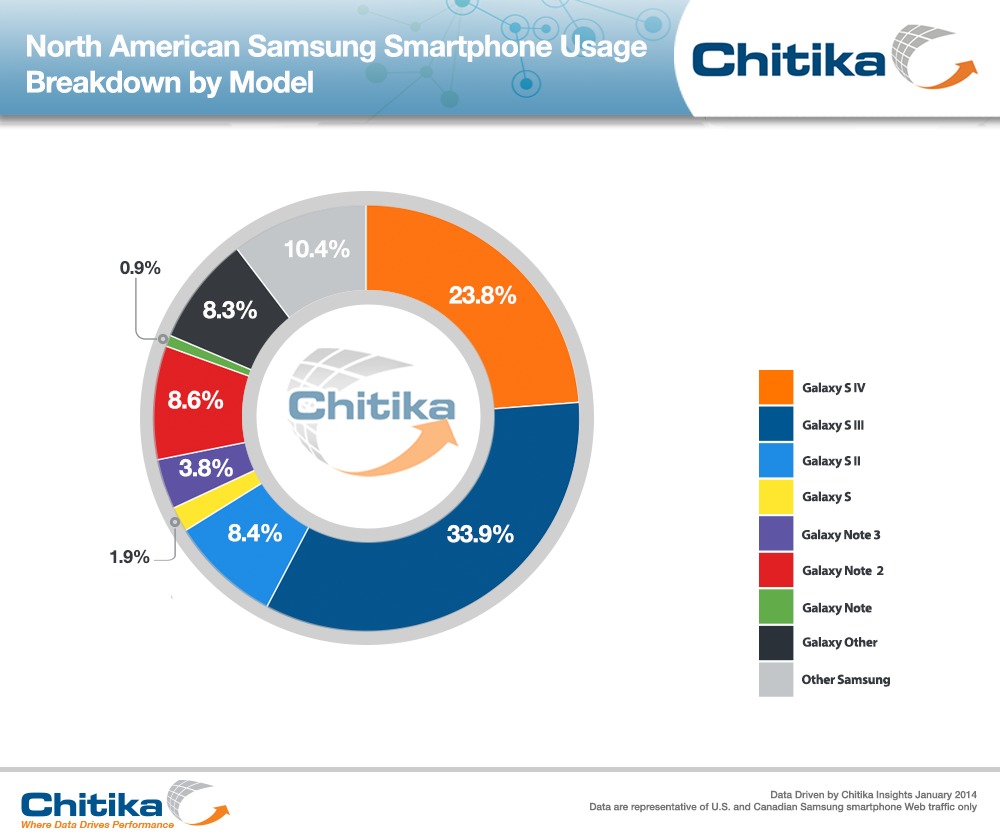
These details are coming by way of a recent report from Chitika, which takes a look at smartphone usage breakdown by model and tablet usage breakdown by screen size. Both are respective for North America. In the case of the smartphone side of the report, we are seeing the Galaxy S III taking top honors with 33.9 percent of the share. Following the S III is the Galaxy S 4 with 23.8 percent.
Interestingly, the third highest percentage here is 10.4 percent, though this is a catch-all for “Other Samsung” devices. The now older Galaxy Note 2 is the third actual device with 8.6 percent of the share. Following that is the Galaxy S II with 8.4 percent and then another catch-all category with 8.3 percent. That last catch-all is for “Galaxy Other” devices. Rounding out the smartphone space here is the Galaxy Note 3 with 3.8 percent, Galaxy S with 1.9 percent and the original Galaxy Note with 0.9 percent.
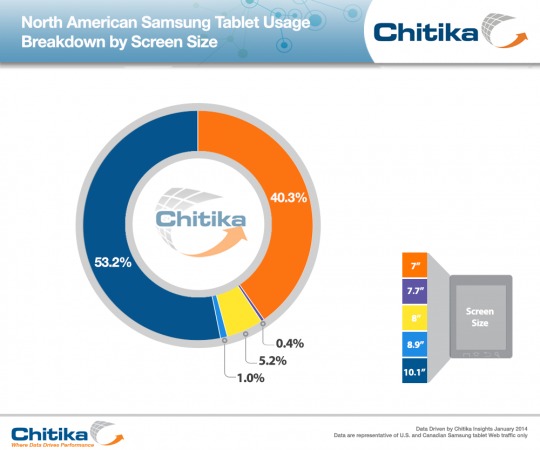
While the smartphone side is broken down by models, and showing many of the previous generation devices are still being widely used, the tablet side of the study shows how many favor the 7 and 10.1-inch tablet sizes. In fact, these two sizes account for 93.5 percent. This is somewhat interesting to see as Samsung seems to have a wide variety of device sizes.

For the record, the 10.1-inch tablets are sitting on the top with 53.2 percent. The 7-inch models are at 40.4 percent. Beyond that, the number drops considerably. The next highest is 5.2 percent for the 8-inch models. Picking up the back of the back, 8.9-inch Samsung tablets account for 1.0 percent and 7.7-inch models account for only 0.4 percent.
Brining some of the smartphone portion of the study to size (similar to the tablet side of the study) and we see users were going more for devices with smaller display sizes. The total percentage for the Galaxy Note lineup is 13.3 percent, which is less than half of what is seen by the Galaxy S III by itself. We should also make mention there is likely more to this than just size, as the Galaxy S III is widely available across carriers and also priced much lower in comparison to the Galaxy Note lineup.
As for the roots of this study, Chitika notes how it was taken from data collected between January 1 and December 31, 2013. Perhaps equally important, the study “analyzed tens of millions of Samsung smartphone- and tablet-based online ad impressions within the Chitika ad network.”
SOURCE: Chitika


